
Web Development
Website Speed Optimization: How to Pass Core Web Vitals Without Sacrificing Design
What LCP, INP and CLS measure, how to check them with real-user data, and the fixes that make a well-designed website feel fast on real devices.

Xevort Team
Zoho & technology experts
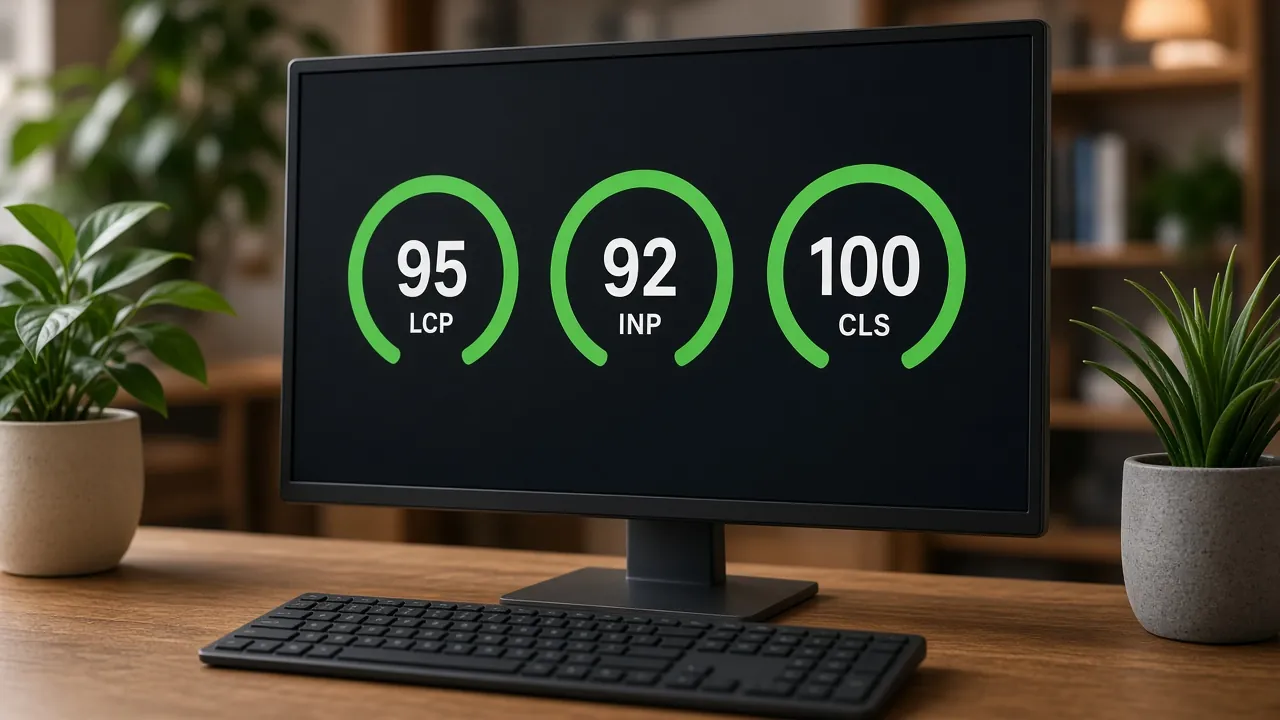
Core Web Vitals optimization is how you turn a good-looking website into one that also feels fast on a real customer's phone. This guide explains what Google's three Core Web Vitals measure, the official thresholds for a good score, how to measure them with field and lab tools, and the specific fixes that actually move the numbers: images, fonts, JavaScript, third-party scripts, caching and layout stability.
It's written for business owners, marketers and product managers who want a faster site without stripping out the design and features that make it work. We also share the performance budget and step-by-step process we use on client projects.
Quick Answer
What does Core Web Vitals optimization involve?
Core Web Vitals optimization means improving three Google metrics measured on real visitors: Largest Contentful Paint for loading (good at 2.5 seconds or less), Interaction to Next Paint for responsiveness (200 milliseconds or less) and Cumulative Layout Shift for visual stability (0.1 or less). A page passes when at least 75% of visits meet all three. Most gains come from optimized images, lean JavaScript, fewer third-party scripts, good caching and reserved space for content.
Key Takeaways
- The Core Web Vitals are LCP, INP and CLS. INP replaced First Input Delay as the responsiveness metric in March 2024.
- Google assesses each metric at the 75th percentile of real page loads, separately for mobile and desktop.
- Field data from real users decides whether you pass; lab tools like Lighthouse help you diagnose issues and catch regressions.
- A performance budget built into design and development protects speed far better than one-off fixes before launch.
Why Website Speed Matters for Your Business
A beautiful website that loads slowly still feels broken. Visitors judge it on their own device, usually a mid-range phone on mobile data, not the laptop it was designed on.
Speed affects outcomes you care about directly:
- Search visibility: Google's Search Central documentation says good Core Web Vitals align with what its core ranking systems seek to reward, alongside other page experience signals.
- Lead capture: slow or jumpy pages lose enquiries before the form is ever submitted, so fewer leads reach your sales team or CRM.
- Trust: buttons that lag or content that shifts under a finger makes a brand feel unreliable.
- Running costs: lighter pages and good caching use less bandwidth and server capacity.
Speed doesn't replace helpful content, but it decides whether visitors stay long enough to read it. That's why our web development team plans for it from day one.
The Core Web Vitals Metrics Explained
Core Web Vitals are the subset of Google's Web Vitals that apply to every web page. The current set covers loading, interactivity and visual stability, and each metric has an official good threshold.
- Largest Contentful Paint (LCP)
- What it measuresLoading: when the largest image or text block becomes visibleGood threshold2.5 seconds or lessCommon causes of poor scoresSlow server response, heavy or lazy-loaded hero images, render-blocking CSS and fonts
- Interaction to Next Paint (INP)
- What it measuresResponsiveness: how quickly the page visually responds to taps, clicks and key pressesGood threshold200 milliseconds or lessCommon causes of poor scoresLong JavaScript tasks, heavy third-party scripts, large DOM updates
- Cumulative Layout Shift (CLS)
- What it measuresVisual stability: how much visible content moves unexpectedlyGood threshold0.1 or lessCommon causes of poor scoresImages and embeds without dimensions, late-loading banners and ads, web font swaps
| Metric | What it measures | Good threshold | Common causes of poor scores |
|---|---|---|---|
| Largest Contentful Paint (LCP) | Loading: when the largest image or text block becomes visible | 2.5 seconds or less | Slow server response, heavy or lazy-loaded hero images, render-blocking CSS and fonts |
| Interaction to Next Paint (INP) | Responsiveness: how quickly the page visually responds to taps, clicks and key presses | 200 milliseconds or less | Long JavaScript tasks, heavy third-party scripts, large DOM updates |
| Cumulative Layout Shift (CLS) | Visual stability: how much visible content moves unexpectedly | 0.1 or less | Images and embeds without dimensions, late-loading banners and ads, web font swaps |
Google recommends measuring each metric at the 75th percentile of page loads, segmented by mobile and desktop. A page passes the assessment only when it meets the good threshold for all three metrics at that percentile.
How to Measure Core Web Vitals
Field Data vs Lab Data
Field data comes from real visitors and decides whether you pass. Google's main field dataset is the Chrome User Experience Report (CrUX). Lab data comes from a simulated page load, such as a Lighthouse run, and is ideal for debugging and testing changes before release.
Lab tools can't measure INP because there's no real user interacting. Lighthouse reports Total Blocking Time (TBT) instead, which is a useful proxy. Reducing TBT in the lab often improves INP in the field.
PageSpeed Insights
PageSpeed Insights shows both views for a single URL: CrUX field data at the top (when your site has enough traffic to be included) and a Lighthouse lab audit with specific recommendations below. Always read the field section first; the lab score is a diagnostic, not the verdict.
Search Console Core Web Vitals Report
The Core Web Vitals report in Google Search Console groups similar URLs and flags which groups are good, need improvement or are poor on mobile and desktop. It's the best place to spot template-wide problems.
Real-User Monitoring
CrUX data is aggregated and not available for every page or smaller site. Google recommends setting up your own real-user monitoring, for example with the open-source web-vitals JavaScript library, so you can see per-page results and react quickly to regressions.
Core Web Vitals Optimization: Fixes by Area
Once you know which metric fails on which templates, work through the areas below. Images and third-party scripts are the most common culprits.
Images
- Serve modern formats such as WebP or AVIF, resized for each screen with responsive srcset.
- Make the LCP image discoverable in the HTML and give it high priority with the fetchpriority attribute.
- Never lazy-load the hero or LCP image; lazy-load images further down the page instead.
- Always set width and height (or an aspect ratio) so the browser reserves space.
Frameworks help here. The Next.js Image component handles sizing, formats and lazy loading by default, one reason we recommend it in Next.js for business websites.
Fonts
Limit the number of font families and weights, self-host fonts where possible, and preload the one or two files used above the fold. Use font-display settings and fallback fonts with similar metrics so text appears quickly without a large shift when the web font arrives.
JavaScript
JavaScript is the main driver of poor INP. Ship less of it: remove unused libraries, split code by route and render content on the server. Break up long tasks so the main thread can respond to input quickly.
Third-Party Scripts
Chat widgets, analytics tags, heatmaps and social embeds all compete for the main thread. Audit every tag, remove what nobody uses, and load the rest after the page is interactive. For lead capture, a lightweight native form that posts into your CRM, such as Zoho CRM, is usually faster than a heavy embedded iframe.
Caching and CDN
A content delivery network (CDN) serves pages and assets from servers close to your visitors, reducing Time to First Byte and LCP. Cache static assets with long lifetimes, cache HTML where your content allows it, and keep pages eligible for the browser's back/forward cache. Our guide to cloud foundations for startups covers how to set this up properly, and good caching also helps with keeping cloud costs under control.
Layout Stability
Reserve space for anything that loads later: images, videos, ad slots and cookie banners. Don't insert content above what the user is reading, and animate with transform and opacity rather than layout properties like top or height.
Set a Performance Budget Before You Design
A performance budget is a set of limits the whole team agrees to before design starts. It turns speed from a last-minute fix into a design constraint, just like brand colors or accessibility. A practical budget usually covers:
- Metric targets: good LCP, INP and CLS at the 75th percentile on mobile.
- Page weight: limits on total JavaScript, CSS and image size per template.
- Hero media: agreed formats and file-size limits for banners and background videos.
- Fonts: a fixed number of families and weights.
- Third-party tags: a short approved list, with an owner for each one.
Design ambition and speed can coexist. Rich visuals and animation work when they're planned within the budget, not added on top of a heavy page.
Our Website Speed Optimization Process
- Check field data
- Find failing templates
- Diagnose root causes
- Fix and lab-test
- Deploy and monitor
- Enforce the budget
We start with Search Console and PageSpeed Insights to see which metrics and page groups fail on mobile, then diagnose the root cause per template (the LCP element, the slowest interactions, the elements that shift) and fix the highest-impact issues first.
Every fix is verified in the lab before release, then monitored in the field, because CrUX data is collected over a rolling 28-day window. If you're planning a bigger overhaul, build these checks into your website redesign checklist rather than retrofitting them after launch.
Common Core Web Vitals Mistakes
Chasing a Perfect Lighthouse Score
A lab score of 100 doesn't guarantee a pass in the field, and a lower lab score doesn't mean failure. Optimize for real-user data first.
Testing Only on Fast Devices
Sites built and reviewed on high-end laptops often struggle on mid-range phones. Test with CPU and network throttling, and on real devices your customers use.
Adding Tags Without Review
Marketing tags added through a tag manager can undo months of work. Give every new script an owner and a performance check before it goes live.
Treating Speed as a One-Time Project
New content, plugins and features slowly add weight. Monitor monthly and keep the budget in your release checklist.
Frequently Asked Questions
What are the three Core Web Vitals?
The three Core Web Vitals are Largest Contentful Paint (LCP), which measures loading; Interaction to Next Paint (INP), which measures responsiveness; and Cumulative Layout Shift (CLS), which measures visual stability. Good scores are an LCP of 2.5 seconds or less, an INP of 200 milliseconds or less and a CLS of 0.1 or less.
What is a good INP score?
A good Interaction to Next Paint score is 200 milliseconds or less, measured at the 75th percentile of page loads. INP replaced First Input Delay as a Core Web Vital in March 2024. Reducing long JavaScript tasks and unnecessary third-party scripts is usually the fastest way to improve it.
Do Core Web Vitals affect Google rankings?
Google says good Core Web Vitals align with what its core ranking systems seek to reward, as part of overall page experience. They don't outweigh relevant, helpful content, but when pages are similarly useful, a faster and more stable experience helps. Speed also tends to help conversions, whatever your rankings.
Why is my PageSpeed Insights score different from Search Console?
The performance score in PageSpeed Insights is a Lighthouse lab test from a single simulated load. Search Console uses field data from real Chrome users, aggregated across groups of similar pages. Field data decides whether you pass Core Web Vitals, so prioritize it when the two disagree.
How long does it take to see Core Web Vitals improvements?
Lab tools reflect fixes immediately, but field data from the Chrome User Experience Report is aggregated over a rolling 28-day period. That means improvements typically take a few weeks to show fully in PageSpeed Insights and the Search Console Core Web Vitals report.
Conclusion
Passing Core Web Vitals doesn't require stripping your website down to plain text. It comes from knowing which metric fails, fixing the real causes (images, scripts, fonts, caching and layout shifts) and protecting the gains with a performance budget the whole team follows.
If your site looks great but feels slow on mobile, we can help you measure, prioritize and fix it without compromising the design. Talk to our web team about a performance review or a faster rebuild.
References

Written by
Xevort Team
Developers and Zoho consultants writing up practical lessons from client projects.
Want help applying this?
Tell us about your Zoho, product or cloud project and we'll suggest a sensible next step.